Spent 44.8 billion yuan to buy traffic in one year, revealing the "traffic password" behind the big manufacturers.
A few days ago, Pinduoduo released its 2021 financial report. According to the financial report, Pinduoduo’s marketing expenses exceed 40 billion yuan, an increase of 3 billion yuan compared with 2020, which is the highest proportion of operating expenses.
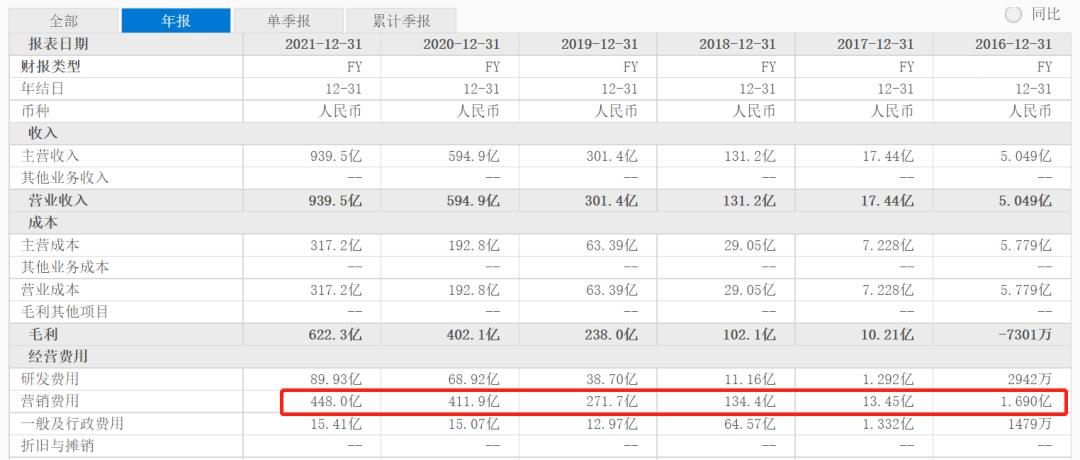
Image source: Oriental Fortune
Although Pinduoduo spent 44.8 billion yuan on marketing in 21 years, it was also full of gains:
The number of active buyers reached 868.7 million, the annual revenue was 93.9499 billion yuan, a year-on-year increase of 58%, and the operating profit exceeded 6.8 billion, which was the most profitable year since its establishment.
In the environment of slow traffic growth, there are many companies like Pinduoduo that have increased their investment in "traffic" and achieved higher revenue growth, such as game company "Gigabit", short video platform "Aauto Quicker" and content e-commerce platform "Little Red Book".
It is an indisputable fact that the traffic cost is getting higher and higher. In such an environment,Operators need to change their traditional operational thinking and use commercial thinking to operate, so as to realize the healthy growth of traffic and income.
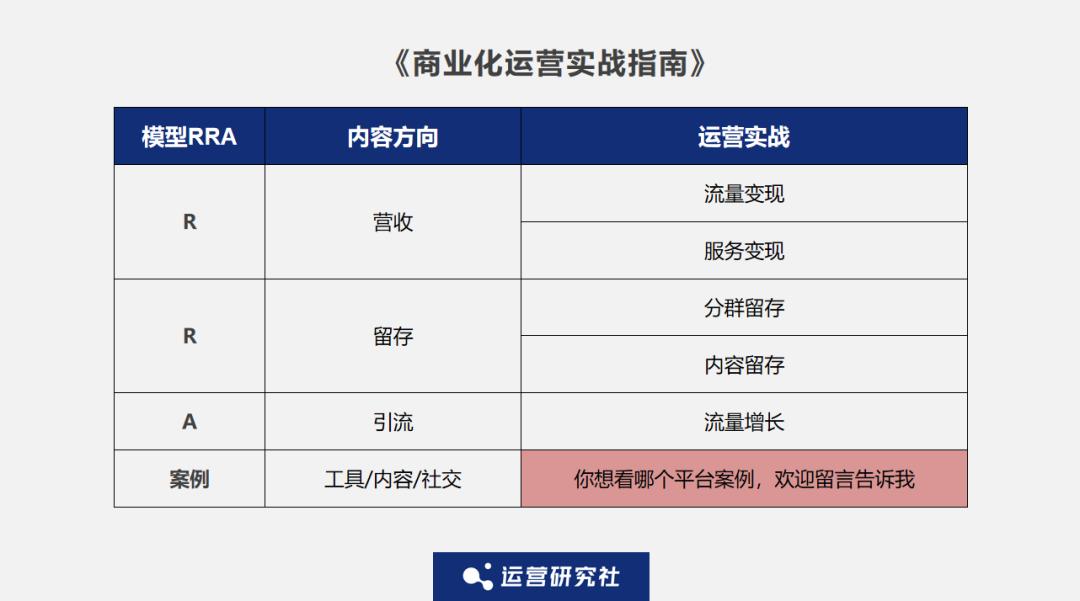
Based on this, the operating agency put forward the RRA model (click to view the contents of the first phase) and opened it. "Commercial Operation Practical Guide" column To study how to realize, retain and drain more efficiently.
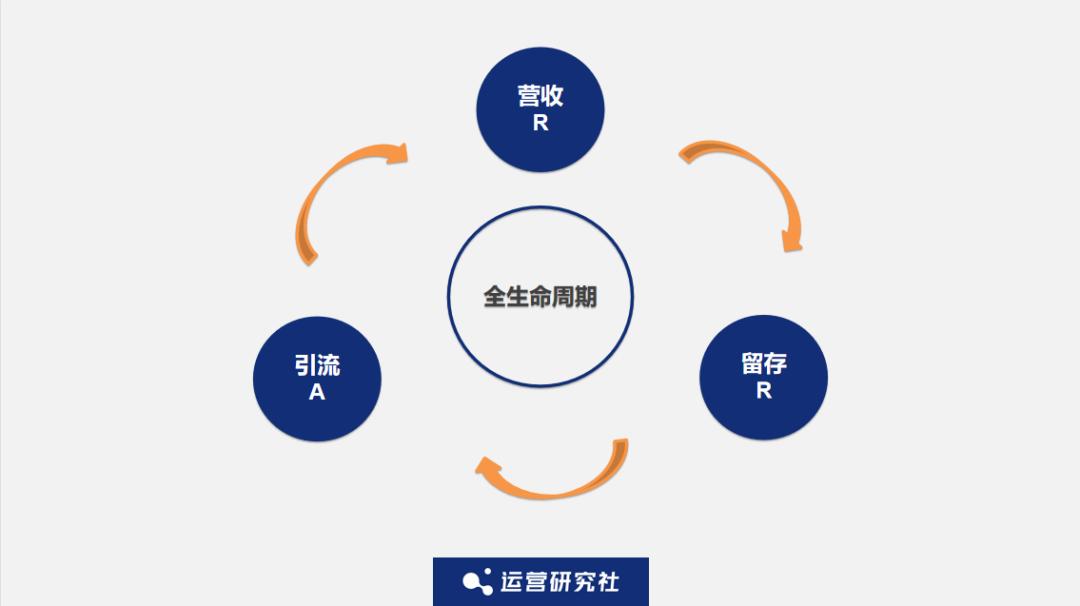
In the previous issues of this column, we talked about the core strategies and methods of "traffic realization" and "service realization" in "R-revenue" and "user group retention" and "content operation retention" in "R-retention" respectively.
This issue is the sixth issue of the column, which enters the third link of RRA model, "A-drainage".
The operation agency will talk to you about how the apps can effectively drain, mainly focusing on the following three issues:
What are the "means" of Internet drainage?
How to achieve efficient traffic growth and increase income?
What are the useful tools for buying and placing?
Before studying how to effectively drain, we must first understand the main drainage methods of the current mobile Internet App.
At present, there are three main drainage methods for App:
First, the flow of natural growth;
Second, the flow of paid purchases;
Third, the flow caused by fission.
Natural growth of traffic refers to the traffic brought by relying on the brand awareness of the product itself to let users spontaneously search and find applications.
In addition, you can also improve the ranking of business keywords through search engine optimization, and then bring traffic.
The paid traffic, as the name implies, refers to the traffic that is bought with money.
For example, tool-based products will increase the investment in buying when the environment is good; Game products will also increase the investment in buying at key nodes such as large festivals, anniversaries, or the launch of new versions.
The traffic brought by fission refers to mobilizing users to spread on social platforms and driving traffic growth through people pulling in.
For example, through product functions, users can drive friends around them to join in. Typical examples are Pinduoduo’s bargaining game, WeChat reading sharing to get a free reading card, and Ding Dong buying vegetables to invite new users to get full or reduced coupons, all of which use fission activities to bring traffic.

Left WeChat reading, right Pinduoduo
Although the natural growth of traffic has low cost and accurate users, it is small in scale, slow in growth and high in long-term investment cost; Although the cost of fission flow is low, the obtained flow is not accurate, and it needs to take great risks (such as risk control to avoid being bonus hunter; Policy risks, suspected of inducing sharing, etc.);
For products with mature liquidity and retention capacity, we suggest to choose paid purchase flow, which is also commonly known as "purchase volume". Let the money earned from cash flow quickly, and directly expand the user scale and revenue growth through the way of "buying quantity".
However, we find that the traditional "buying quantity" pays more attention to the growth of users, and a small number of them can pay attention to the retention rate index. This is why the cashing team and the buying team often "throw pots at each other": the value of the increased buying quantity is low, and the growth complains that the cashing is not effective and there is no money to engage in the quantity.
This also leads to a question that all operators should think about: How should "buying quantity" and "realizing" cooperate?
The "buying volume" from the perspective of commercial operation is to find the leverage that can make the user scale and revenue scale grow rapidly.
The purpose of "buying quantity" is to achieve effective growth. If the bought quantity cannot be retained or realized, it will accelerate the deterioration of business indicators.
Then, how to improve the scale of product users and revenue through "buying quantity" and maximize the return on buying quantity?
The operation agency believes that the ability of "data analysis" in the whole process of buying, retaining and realizing is the key. Here, we will share with you three steps of how to use data analysis to achieve efficient traffic growth and income increase.
In order to achieve high-speed traffic growth and create revenue, the first step is to sort out the core data indicators of "buying side" and "realizing side" according to business processes.
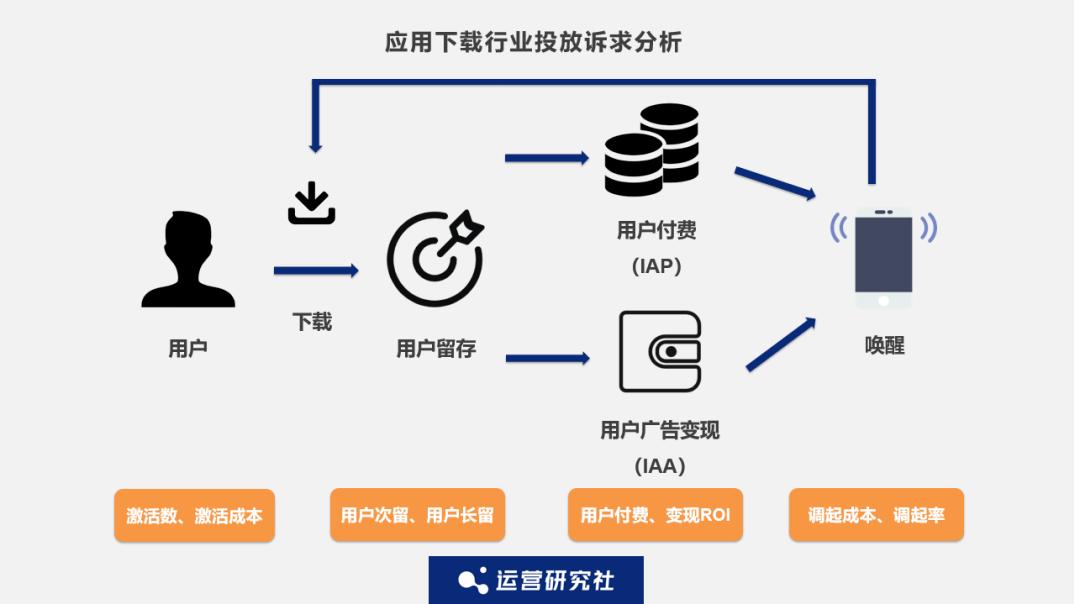
From the purchase level, we should first consider that when users download an App, their download behavior corresponds to the "activation" related data of the App:
For example, activation number, activation cost, etc., in addition, we should also consider the relevant data of the launch plan created on the advertising platform, such as exposure, clicks, consumption amount, etc.
Secondly, we need to consider the "retention rate" indicator when users download the App. Pay special attention to the user’s next-day retention rate and the user’s long-term retention (usually 7-day retention and 30-day retention), because the retention rate is the core data to measure the value of a traffic, so as to evaluate the matching degree between the bought traffic and the product value.
From the realization level, we need to monitor the "user value" data of users in the App. , mainly including the user’s in-house purchase payment amount (IAP) and the user’s advertising realized income (IAA), and comprehensively calculate the user’s LTV (user life cycle value).
IAP (In-App Purchase): refers to the realization of in-house purchase by users.
IAA (In-App Advertisement): refers to the realization of user advertisements.
When we collect the core data indicators of the whole process of buying, retaining and realizing, the second step is to evaluate the recovery effect of buying according to the existing data. How to do it specifically?
Let’s take a look at the calculation formula of the purchase recovery efficiency, that is, purchase ROI= realized LTV/ purchase CPA.
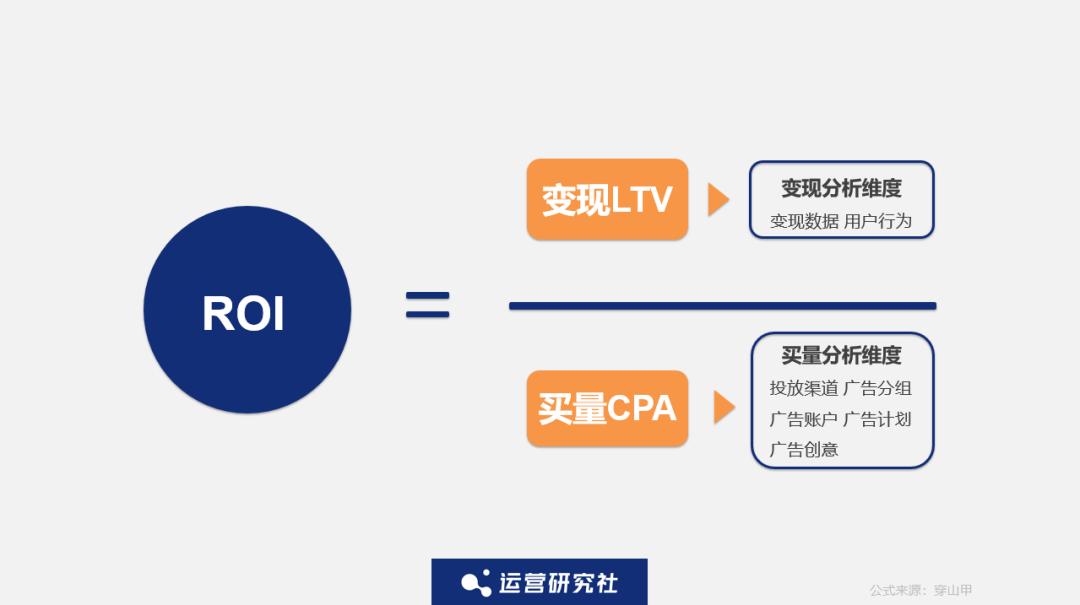
Formula source: pangolin
From the evaluation formula of purchase efficiency, we can see that the main factors affecting ROI are realizing LTV and purchasing CPA, that is, the income generated by users/the cost needed to buy these users.
Based on this formula, we can further analyze it from two dimensions:
First, LTV corresponds to the analysis and optimization of "liquidation side":
Focus on the analysis of user "realization data" and "user behavior" data imported from different purchase channels, such as exposure, click, revenue, penetration and other realization data.
Second, CPA corresponds to the cost optimization of the "buying side":
It can be analyzed according to different dimensions of purchase volume, such as data analysis according to delivery channels, advertising accounts and advertising plans.
If you want to evaluate the effect of buying quantity recovery, you must get through the buying quantity and realize the data at both ends. Disassemble and analyze from ROI to realizing LTV and purchasing CPA, realize continuous optimization from whole to subdivision, and provide a solid foundation for "careful calculation" for subsequent purchasing.
The last step is to optimize and adjust according to the conclusion of data analysis, continuously improve the ROI of buying volume and buy higher quality traffic, thus forming a virtuous circle.
Next, the operating agency will talk about how to optimize the delivery effect from these two aspects.
① Purchase side: Optimization of purchase channels.
When monitoring the purchase channels, the key data indicator is ROI, and the channel is optimized by comparing the ROI data of different channels.
The higher the ROI, the higher the volume: realizing good channels, increasing investment, buying better traffic, and buying more high-conversion users, the realization income will continue to increase; If the ROI is low, further analysis will be made: where it is not realized well, analyze the buying effect of similar products in this channel, and then make optimization and adjustment.
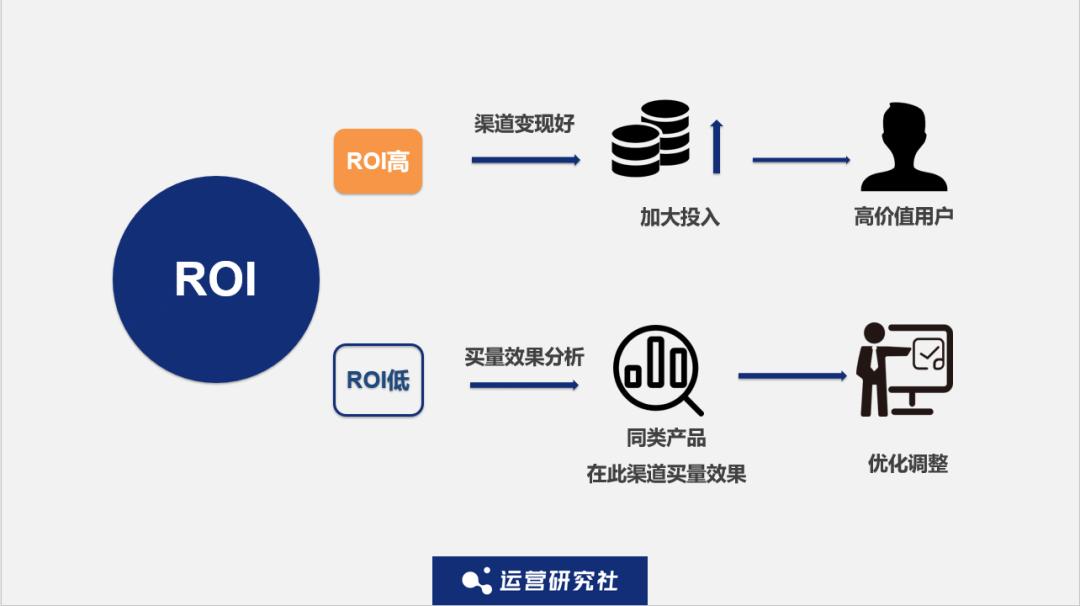
Under the double optimization, the overall ROI is continuously improved, and the profit space can be greatly improved.
② Liquidation side: income structure optimization.
Income structure analysis refers to the analysis of the recovery effect of traffic from the perspective of advertising realization scene. For commercial operation, we can further refine the income of different realization scenarios in the product (including realization effect and realization trend).
Then, according to the income structure analysis data, the advertising position is optimized.
Looking at the revenue of different advertising positions, eCPM (revenue obtained from every 1000 advertisements) and other data, you can increase traffic exposure and purchase investment for advertising positions with higher realized revenue and higher eCPM.
On the contrary, for advertising positions with low revenue and low eCPM, more detailed analysis is needed, such as request penetration rate, display penetration rate, per capita request, per capita display rate, click-through rate and other indicators, so as to find the core issues for optimization or replacement of channels and advertising positions.
Through the detailed explanation of the above contents, we know that in order to achieve efficient traffic growth and increase revenue, we need to find the core data indicators of the business and make optimization and adjustment according to the analysis results of the core data.
The whole process goes down, which tests the overall data analysis ability of realizing the purchase amount of the operation. Then, how to realize the full link data analysis of buying, retaining and realizing?
At present, there are two kinds of common data analysis tools on the market:
The first category, tools for self-built data background.
Such tools are generally self-built by App. On the one hand, they can obtain complete data, accurate data analysis results and rich analysis dimensions. On the other hand, they can also be customized according to the different liquidity needs of App. (Ps. Creating such tools requires the company to invest a lot of money and energy)
The second category is user behavior data analysis tools.
Commercial operations can use user behavior data analysis tools, which saves time and effort, and second, such tools have certain data analysis capabilities. However, it can’t get the data of advertising monetization income, and the full link data analysis of purchase, retention and monetization is all at the breakpoint.
If we can combine the advantages of the two, it would be great for developers and operators.
Here we talk about the third kind of tools: the tools for improving efficiency and tuning on the third-party advertising monetization platform. Typical domestic products, such as pangolin, can combine the advantages of the first and second tools. In terms of data acquisition, the growth staff can provide more comprehensive data for operators, covering the realization of purchase volume, such as:
Delivery effect: ROI comparison of different delivery channels and advertising plans;
Liquidation: analyze the liquidation income and liquidation behavior data (penetration rate, liquidation display and liquidation click);
User behavior: user retention, per capita usage time.
It is worth mentioning that these data are all day-level data and hour-level data, covering the data of buying and realizing, and have more comprehensive data reference.
In terms of analysis ability, operators can also customize data items and conduct detailed analysis. The whole data runs through the user’s whole life cycle, analyzing the purchase volume and realizing the growth of traffic and income.
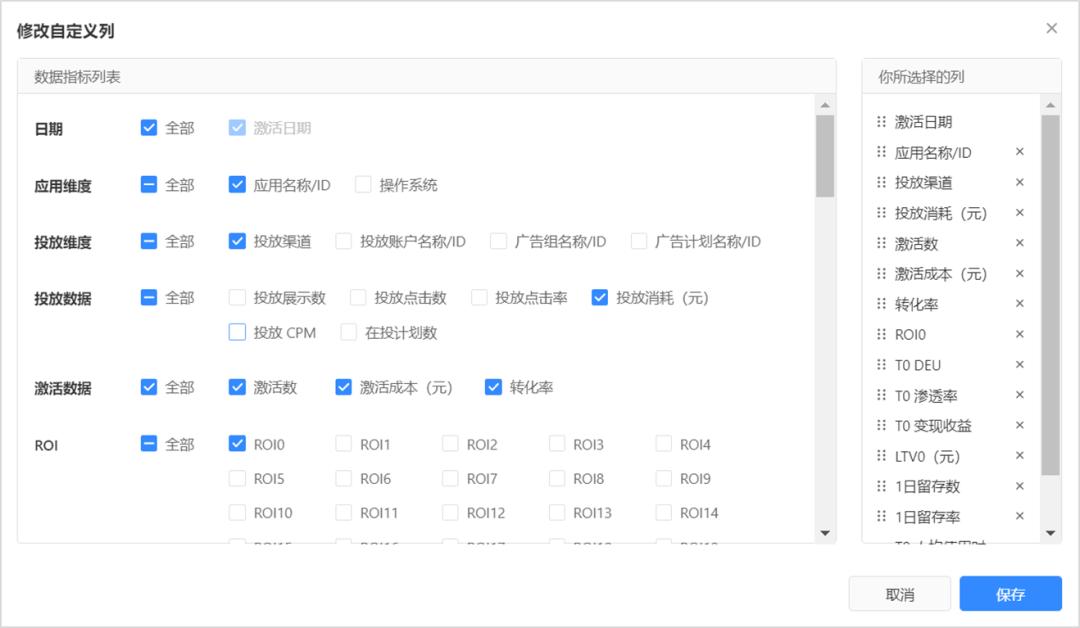
Image source: Pangolin "Growth Staff" product introduction
Operators can also analyze the effects of different channels and screen out channels with high ROI.
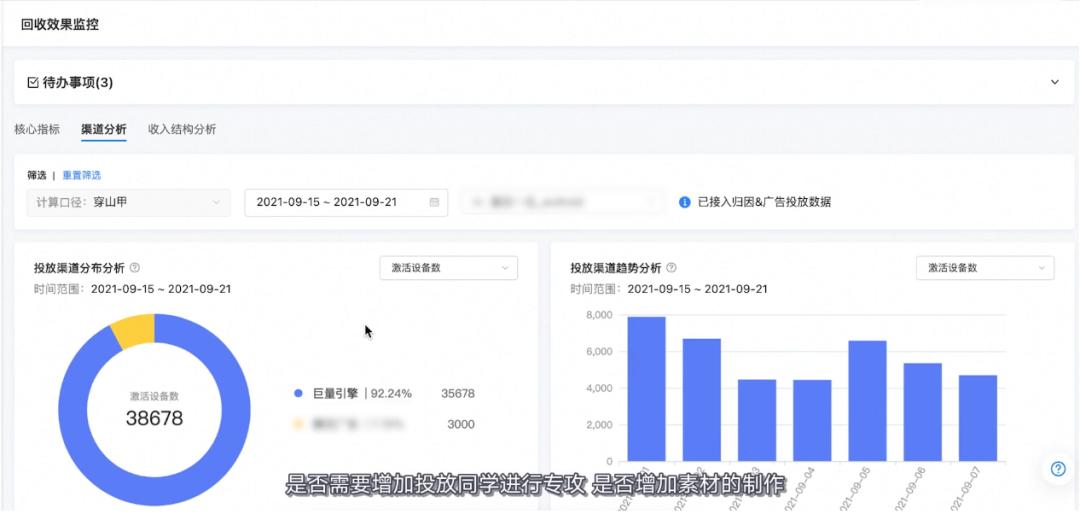
Image source: pangolin "growth staff" product open class
A big problem that many developers will face in the process of commercialization is the lack of data capacity, and there is a high evaluation requirement for the recycling effect. In order to break the bottleneck, make advertising more effective and bring higher return on investment to the team, they have chosen to access the growth staff.
For example, a head game App can’t monitor the changed data in real time through self-built data background analysis before accessing the growth staff, and the purchase quantity lacks scientific reference, so it can’t adjust the purchase strategy in real time.
After accessing the growth staff, the commercial operation can gain insight into the different stages of products and adjust the purchase strategy, find the key factors that affect the realization of purchase volume, and enlarge the users with high conversion intention, so that the overall profit rate has increased by more than 70% and the first day ROI has increased by more than 35%.
Generally speaking, the commercial operation based on RRA model not only requires operators to understand the business model, take stock of their own resources, and find the right way to realize, but also needs to be able to do the work of efficient traffic growth and revenue growth from the perspective of realizing, so as to improve the realization efficiency of products.
Above, it is Practical Guide to Commercial Operation I believe that sharing the strategies and skills of launching can help developers and operators to improve the quality of traffic, reduce the cost of launching and maximize the benefits.
Practical Guide to Commercial OperationIn the next issue of a series of columns, we will disassemble specific industry cases from the whole process of revenue-retention-drainage based on the RRA model, so stay tuned.
Author | Guo Xiaoshuang
Editor | Yang Peiwen
Design | Talking about Meng Jie
This article comes from WeChat WeChat official account "Operation Research Society" (ID: u _ quan). Author: Editorial Department of Operation Society, published by 36Kr with authorization.